Forex trading is really exciting but also pretty scary for those with little or no experience in the market. Of course, mastering Forex charts is one of the essentials for successful Forex trading. That was really overwhelming for new traders looking at the Forex chart, but it remains a very important tool in helping the analysts understand currency price movements and trends and make informed decisions. This is the exhaustive guide to break everything you need to know about Forex charts—what it is, its importance, and how to interpret it effectively.
What are Forex Charts?
Forex charts are graphical representations of how the prices of a given currency pair have changed over some period of time. They hold much information regarding price trends, patterns, and even potential points of entry and exit into trades. Knowledge about Forex charts is one of those fundamental skills expected of every trader, as it provides the ability to make the right decisions in relation to historical and current data of a market.
Short History of Forex Charts
Forex charts have evolved into a component of significant evolution. The earlier days of forex trading entailed the use of more basic tools, such as price lists and line charts tracking currency movements, but technology advancements had also bought better tools for charting. In the 20th century, bar charts and candlestick charts emerged popularly in the financial markets, with digital trading platforms rising, these charts are now easily accessed around the globe by traders.
Perhaps the most significant discovery in Forex chart history is the use of Japanese candlestick patterns imported to the West during the 1970s. These are centuries-old creations by the Japanese rice traders, who were among the first traders ever, and are still used today because of their ability to provide detailed insights on market sentiment.
Why Forex Charts are Indispensable for Traders?
Forex charts are very important to traders since they enable an average view of the market. Here are some reasons why Forex charts are so important:
Identification of Trends: With Forex charts, a trader can trace long-term and even short-term trends that could be very important in trading for profitable movements.
Prediction of Future Movements: The interpretation of historical data enables a trader to make relatively educated guesses about future price movements.
Timing Trades: Forex charts help traders to time their trades perfectly because they indicate the major levels and zones.
Risk Management: Due to knowing the previous trends of prices, the stop loss levels can be set to remove some risks.
Types of Forex Charts
There are three main types of Forex charts used by a trader.
Line Chart

One of the most basic Forex charts is a line chart. A line chart connects closing prices of a currency pair over some period of time with a continuous line. Line charts are very simple to view the general trend and very good for beginners. It does not carry any detailed information about opening, high, and low prices.
Bar Chart

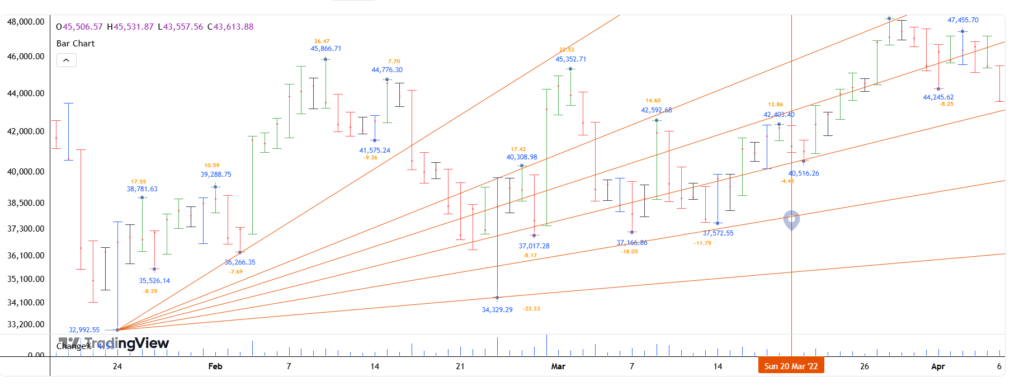
A bar chart is slightly more elaborate than a line chart, as it represents more data points for every period of time. For instance, one time period may have one bar representing the opening, high, low, and closing prices. Bar charts will provide a more detailed view of the price movement within each period.
Candlestick Chart

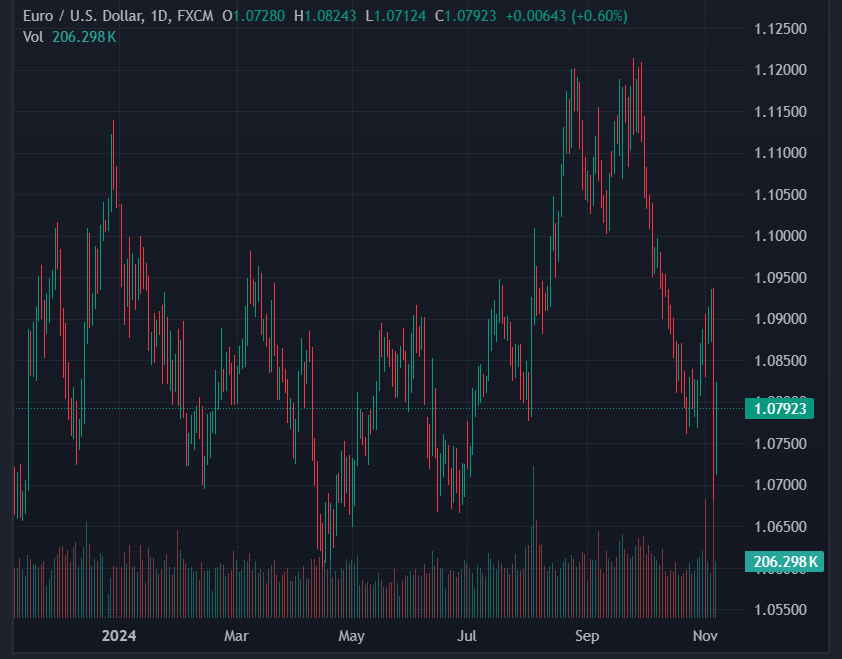
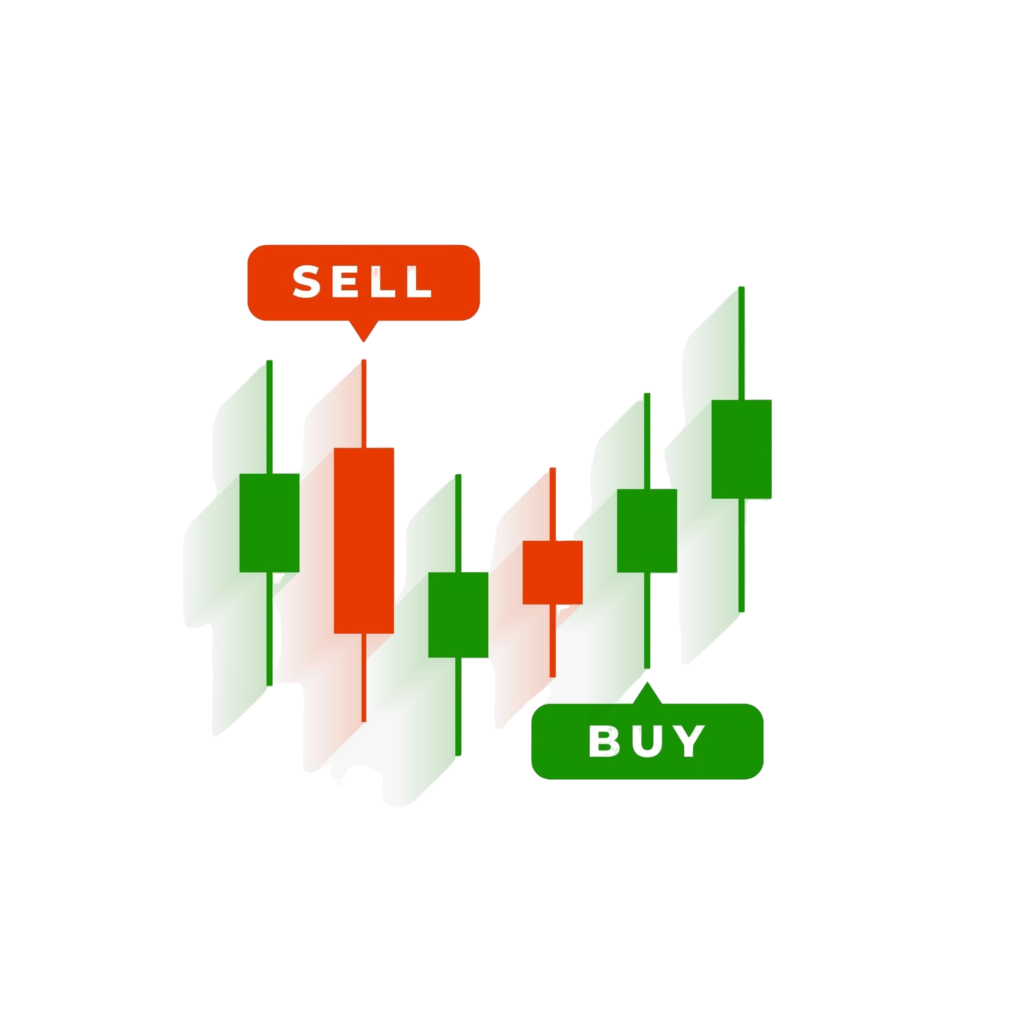
By far, this is the most popular Forex trader type of candlestick chart, used among all others for the richness of information presented graphically as well as for the clarity of its presentation. It represents a given period and indicates opening, closing, high, and low prices. The “body” part indicates the price range between the opening and closing, while the “wicks” or the “shadows” of the candle indicate the high and low prices. Candlestick charts have inherent value for insight into market sentiments.
Time frame Definition in Forex Charts
Forex charts have timeframes that go from one minute to one month. The time frame you select is a trade-off according to the type of trading you do :
- Short-term traders (scalpers and day traders) use 1-minute, 5-minute, or 15-minute charts.
- Swing traders mostly work off of 1-hour, 4-hour, or daily charts.
- Long-term traders, or position traders, can refer to a weekly or monthly chart.
Always choose the right time frame when you pick your strategy for trading using the market analysis.
Simple Elements of the Forex Chart
A Forex chart looks fairly complicated at first glance, but they are constructed from only a few simple elements:
- Price: The vertical left scale of the graph is the price of the currency pair.
- Timeframe: The time span that will be displayed is the horizontal scale on the graph.
- Volume: Also, some charts include trading volume, which a trader may use to work out the strength of a price move.
Basic Chart Patterns and Their Interpretations
There are quite many charts used in the Forex marketplace; all of them help traders to anticipate potential moves of the price. There are three common patterns presented below:
- Trend Patterns: These patterns indicate the price movement tendency. The simplest trends are the uptrend or higher high and higher low, the downtrend or lower highs and lower lows, and the sideways trend or price consolidates in a range.
- Reversal Patterns: Reversal patterns provide a signal that a trend may be reversing or in the process of a change. The head and shoulders, double tops and bottoms, and inverse head and shoulders are the most followed reversal patterns.
- Continuation Patterns: Continuation patterns indicate that a trend is likely to continue. These are flags, pennants, and rectangles .
Common Forex Indicators for Analysis
Forex indicators are technical devices that assist a trader in analyzing data and identifying probable trades. There are several Forex indicators. Some of the common ones include:
- Moving Averages: Moving averages are applied to process raw price data in order to help a trader establish a direction of the trend. There are two basic categories; the simple moving average (SMA) and the exponential moving average (EMA).
- Relative Strength Index (RSI): RSI is a momentum oscillator that measures the speed and change of price movements. It has a range between 0 and 100, and when its value exceeds 70, then this security is overbought, while below 30 means that it is oversold.
- Moving Average Convergence Divergence (MACD): MACD is a trend-following momentum indicator that shows the relationship between two moving averages of a currency’s price.
How to Read Forex Charts Like a Pro
Reading Forex charts properly
- Trend determination: Ascertain whether the currency pair is in an uptrend, a downtrend, or a sideways trend.
- Analysis of Patterns in Charts: The formation of head and shoulders or double tops, and so on, can indicate a reversal or even continuation.
Use indicators, such as RSI or MACD to confirm your analysis and bring greater accuracy.
Practice: The only way to gain is through practice. Begin with demo trading to gain confidence.
Common Mistakes to Avoid While Reading Forex Charts
- Over complicated chart: Avoid over using indicators since they tend to confuse rather than helping.
- News and events are ignored: FOREX is sensitive to economic events hence ignoring them leads to huge surprises.
- Not managing risk: Always set a stop-loss order to manage risk effectively.
Final Few Words to Learn Forex Charts
Learning Forex charts is not a one-time process and is considered to be practiced but here’s some final tips to begin with:
- Simplicity: Begin with one or two types of charts and minimal number of indicators.
- Keeping Up with Changes: The market conditions change; hence, keep abreast of the global economic events that will affect the Forex markets.
- Patience: Regular practice and learning builds up ability to read charts over time.
Forex charts are a useful tool that, once mastered, can enhance the trade decisions of traders in the Forex market. Starting from such a strong foundation and gradually working up your skills would give you the confidence to achieve highly accurate and profitable trading. And don’t forget, practice makes perfect, so don’t be afraid to spend a bit of time exploring and experimenting with Forex charts to make you more proficient and successful in this arena.
